A history of climate science from the scientists' perspective
Researchers tell us about the advances they consider major in their respective fields… A timeline originally published on The Conversation .
1823
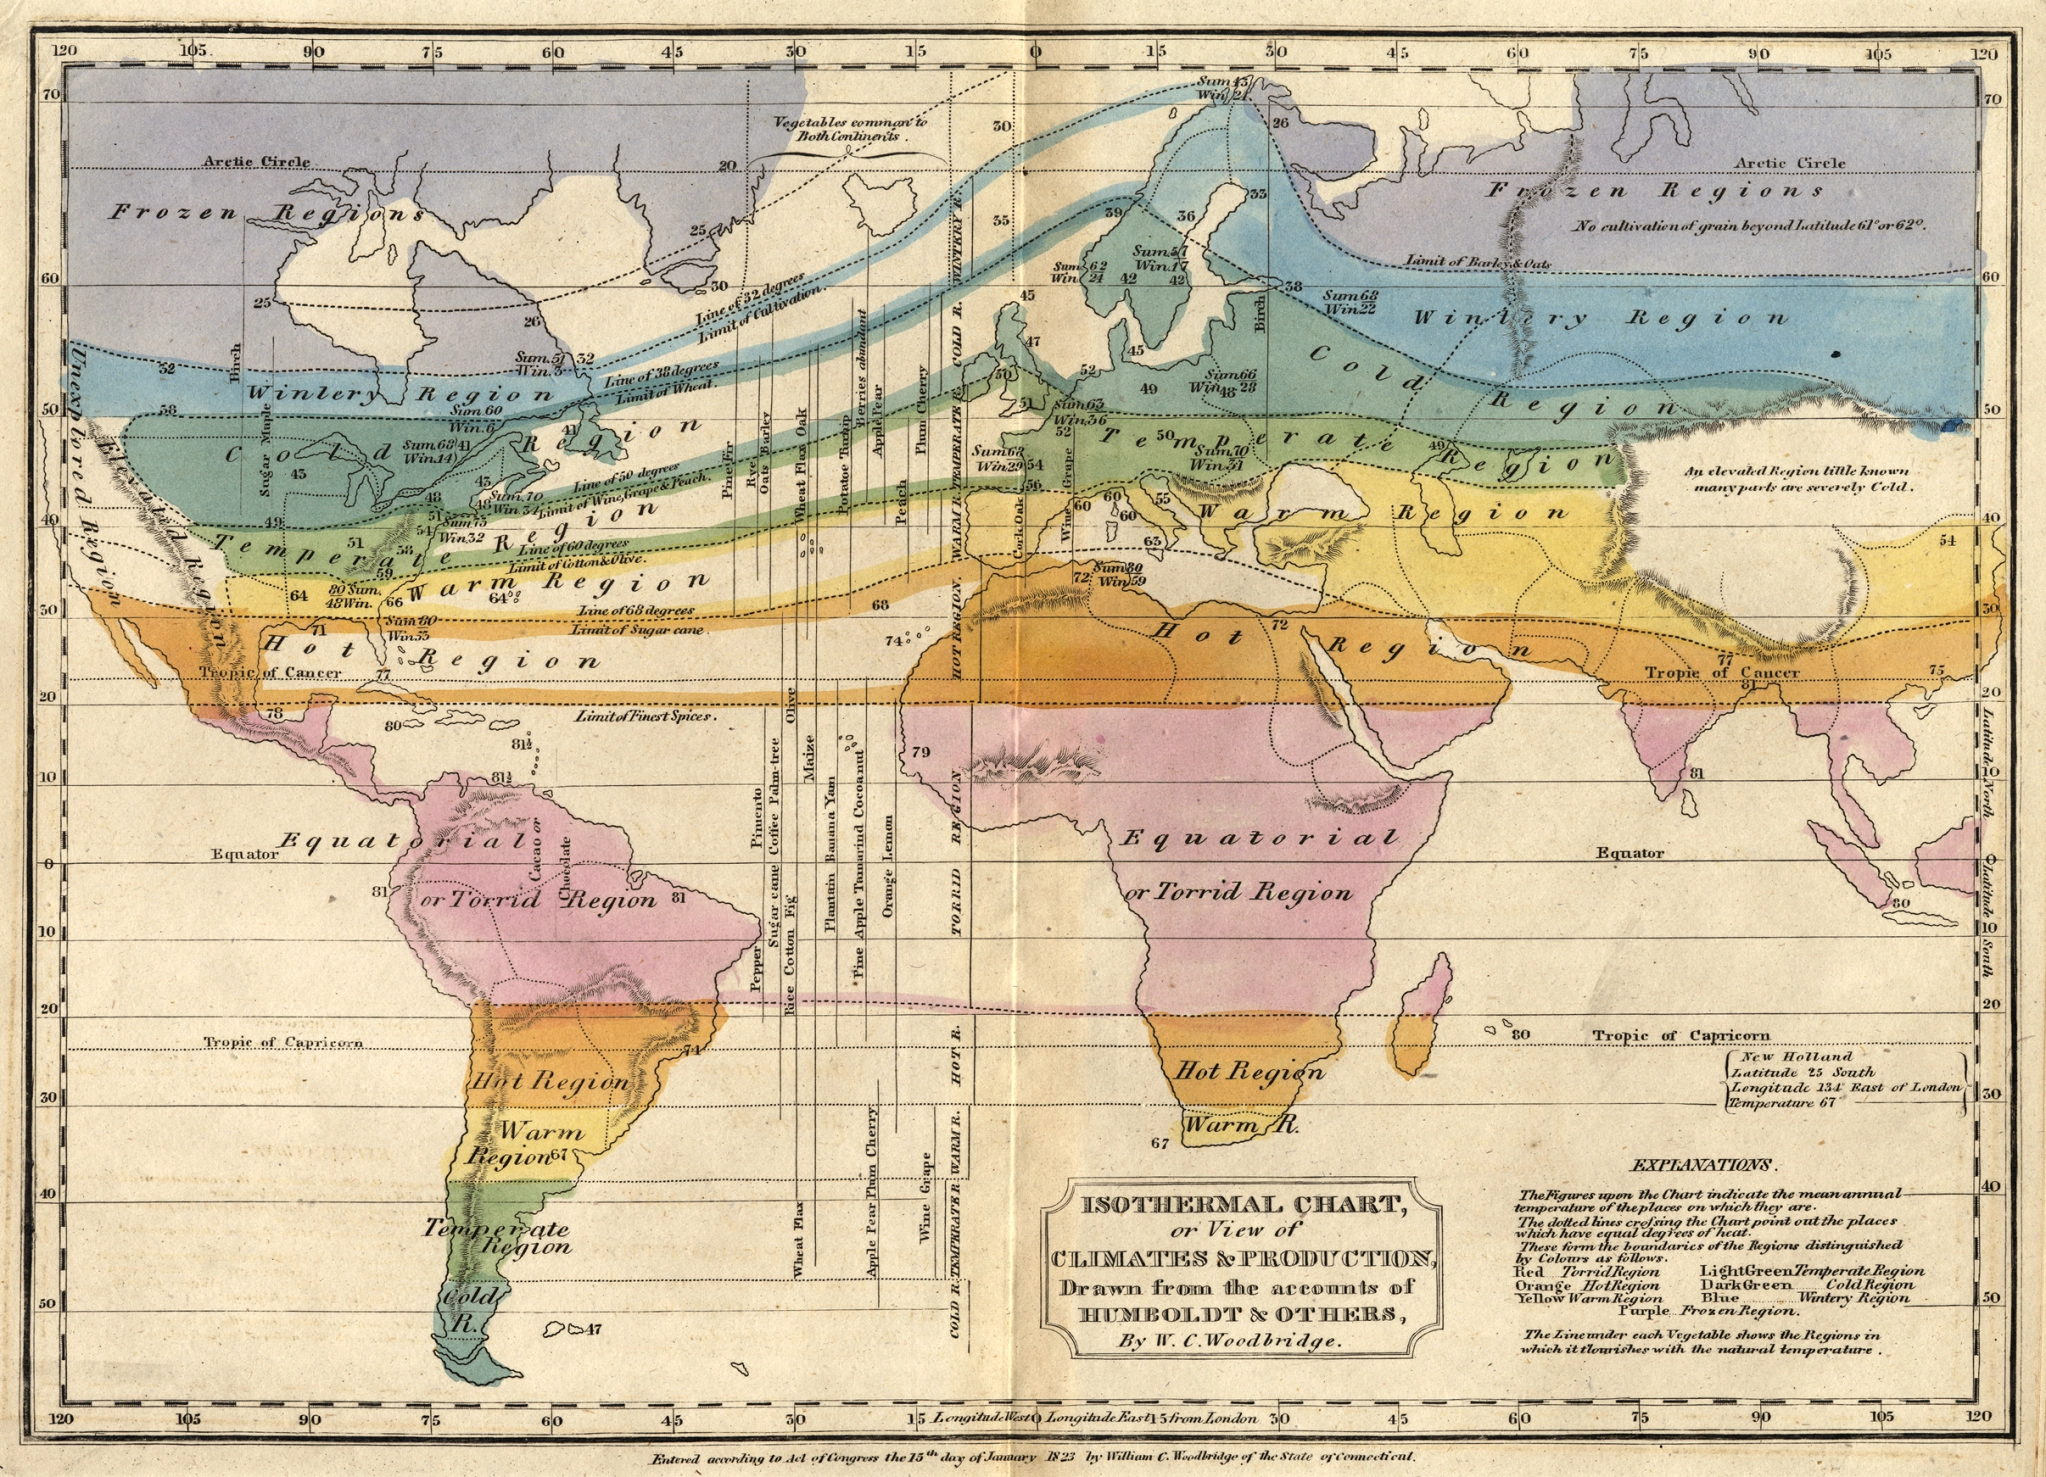
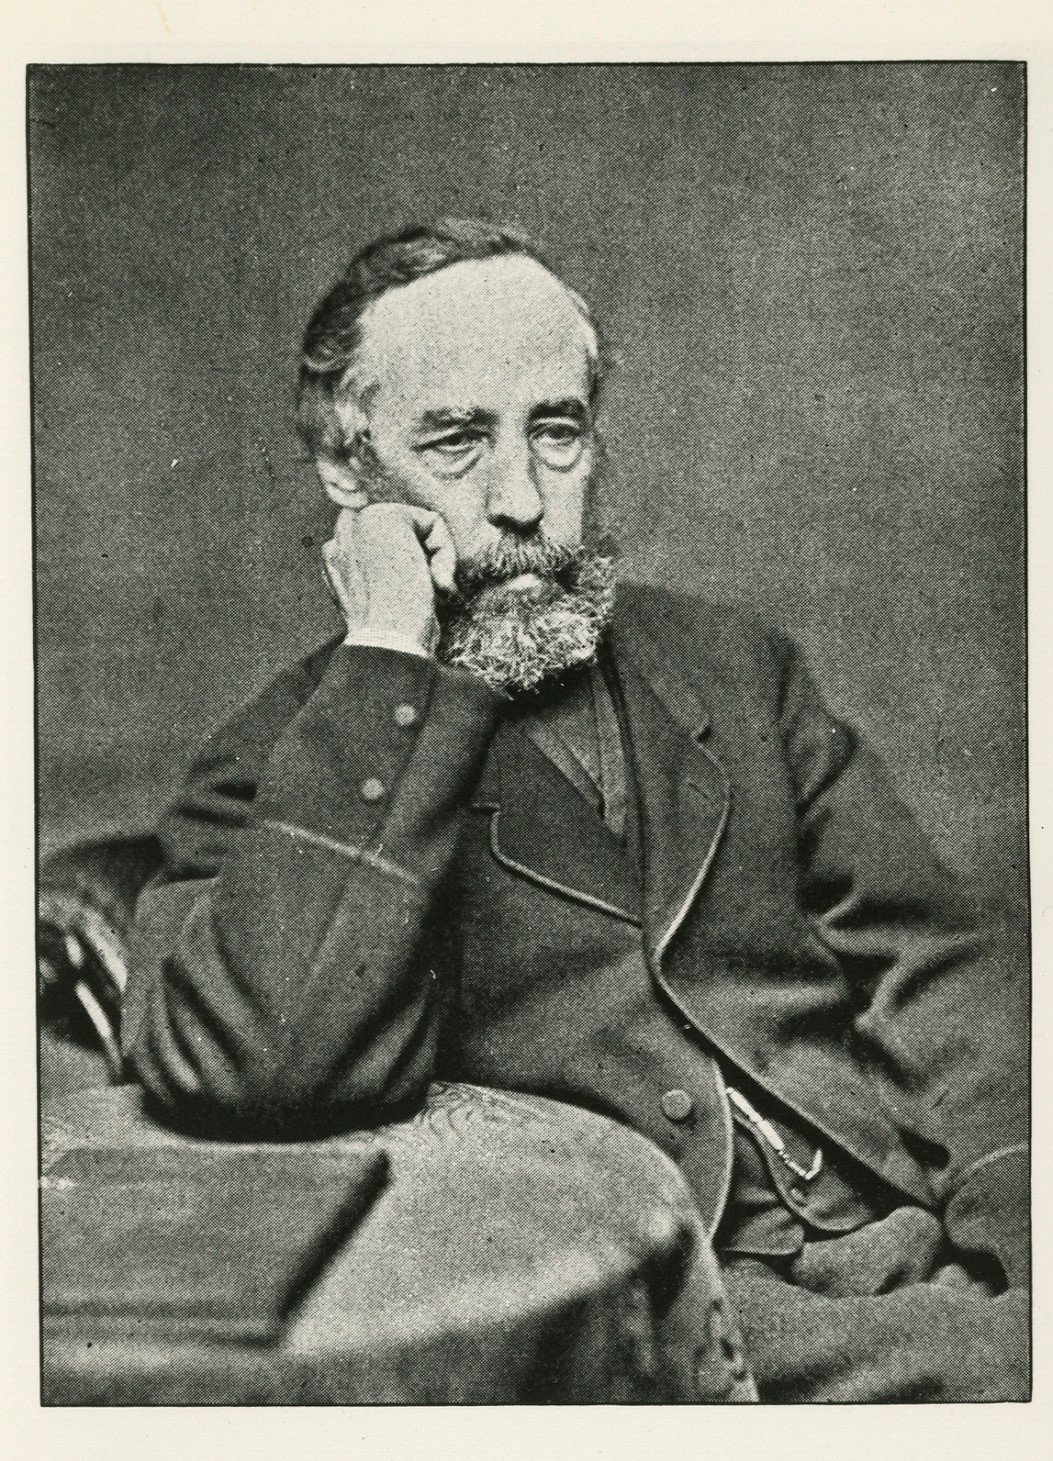
"Alexander von Humboldt created the first isothermal map of the world. He illustrated the distribution of temperatures on Earth resulting from an uneven distribution of solar energy and its redistribution by ocean currents. By highlighting the essential role of the ocean in climate, he is considered a pioneer in climatology and oceanography."
Mireille Lefèvre, researcher specializing in marine biology and solar radiation.
1824
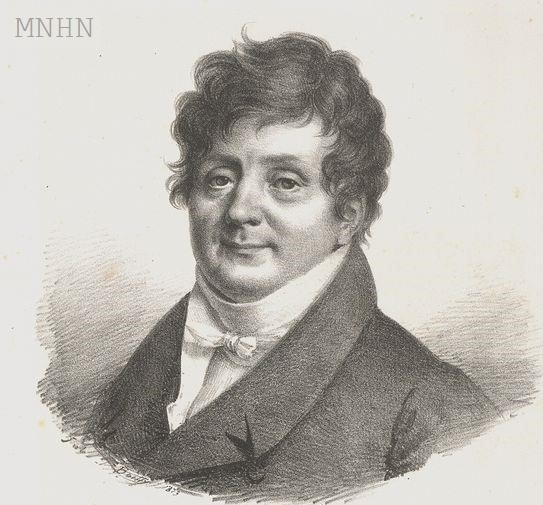
"Joseph Fourier founded the physics of climate (the temperature of the planets adjusts to cancel the energy balance) and the principle of the greenhouse effect."
Jean-Louis Dufresne, climate physics researcher, studying climate change, feedbacks and energy exchanges by radiation.
1840
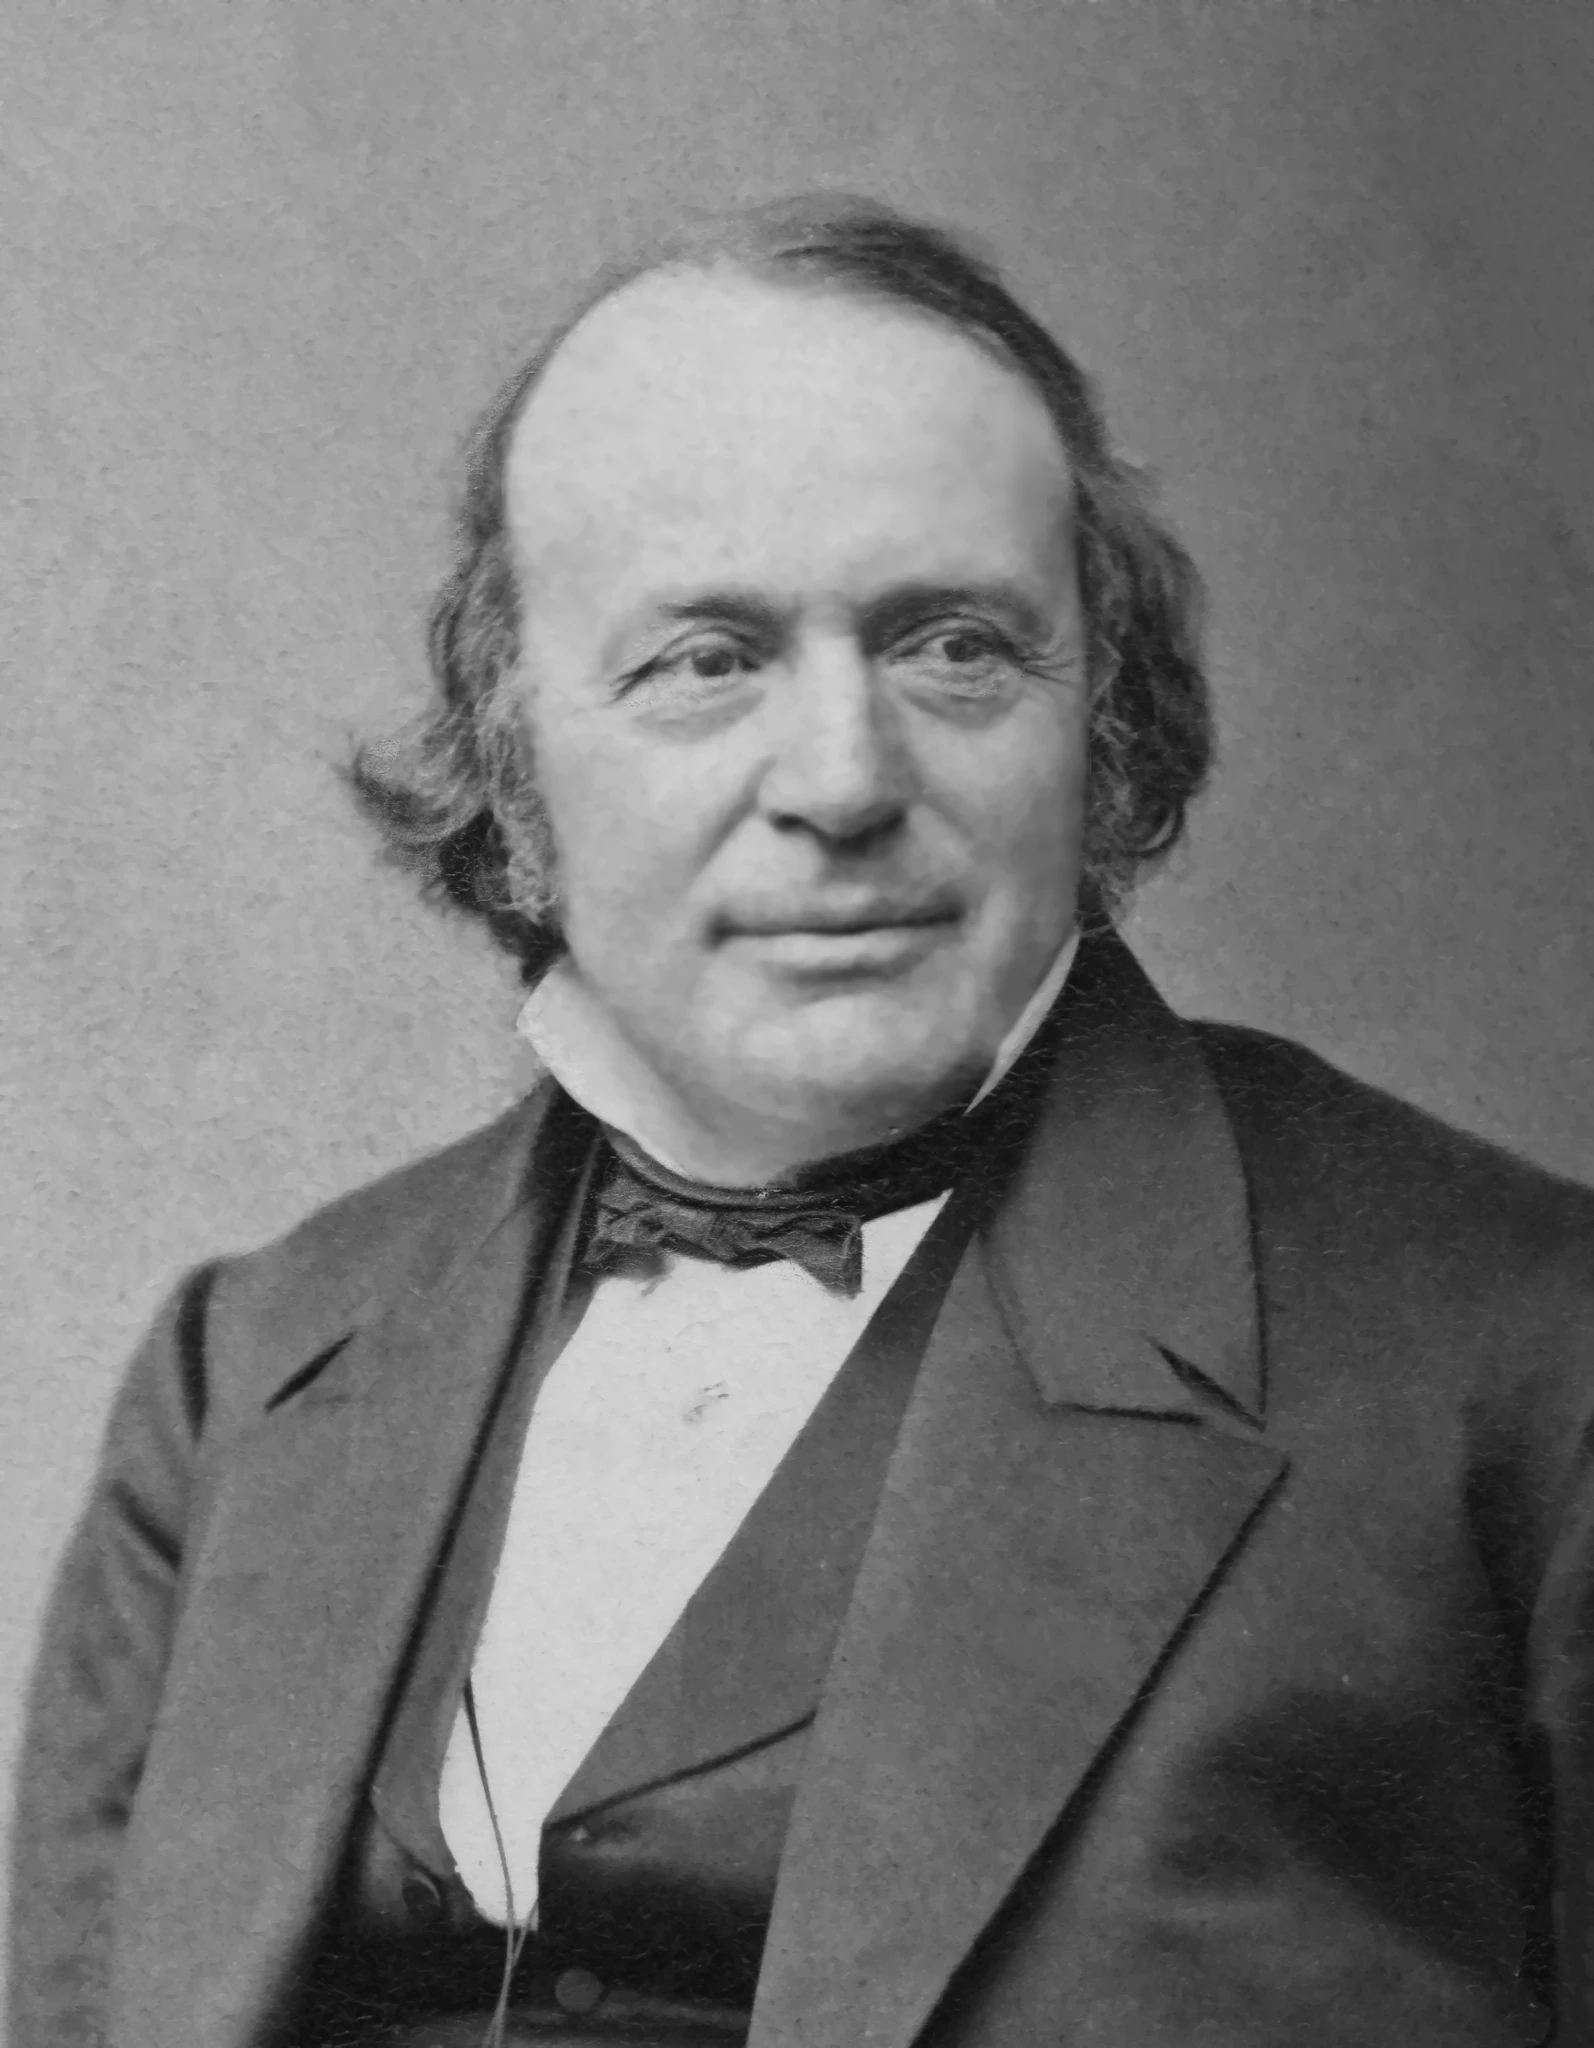
"Louis Agassiz (who took up a suggestion from Charpentier) proposed that the erratic blocks did not result from the Flood but from the extension of the glaciers."
Jean-Robert Petit, glaciologist.
1867
"James Croll (taking up a suggestion by Adhémar) proposes that the cycle of precession (and therefore the position of the Earth in relation to the Sun, known since Antiquity) could lead to cycles of glaciations."
Jean-Robert Petit, glaciologist.
1873
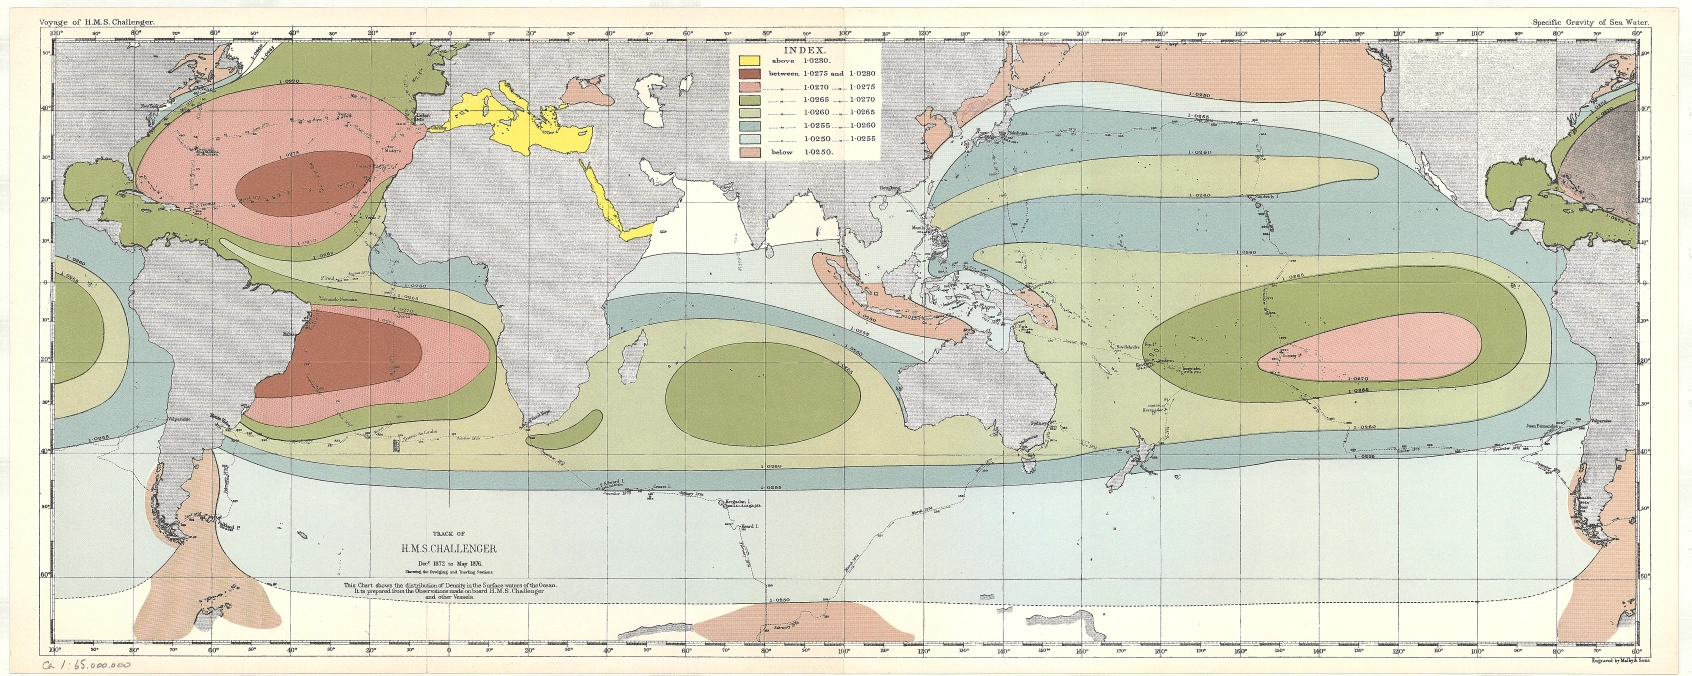
"Start of systematic ocean expeditions (Challenger Expedition, in particular)."
Gilles Reverdin, oceanographer.
1896
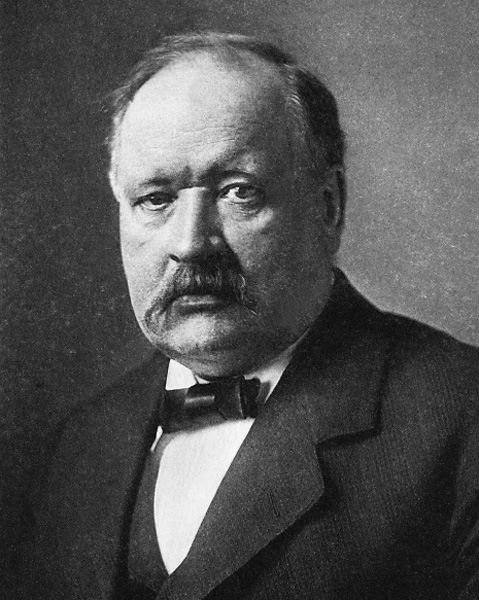
"Svante Arrhenius suggests, to counter Croll, that glaciations are associated with the decline in CO2 and its greenhouse effect."
Jean-Robert Petit, glaciologist.
1930
"Milutin Milanković calculates the energy received by the Earth at each latitude, and suggests that its variations at 65°N are significant and can initiate the process of glaciation or deglaciation."
Jean-Robert Petit, glaciologist.
1938
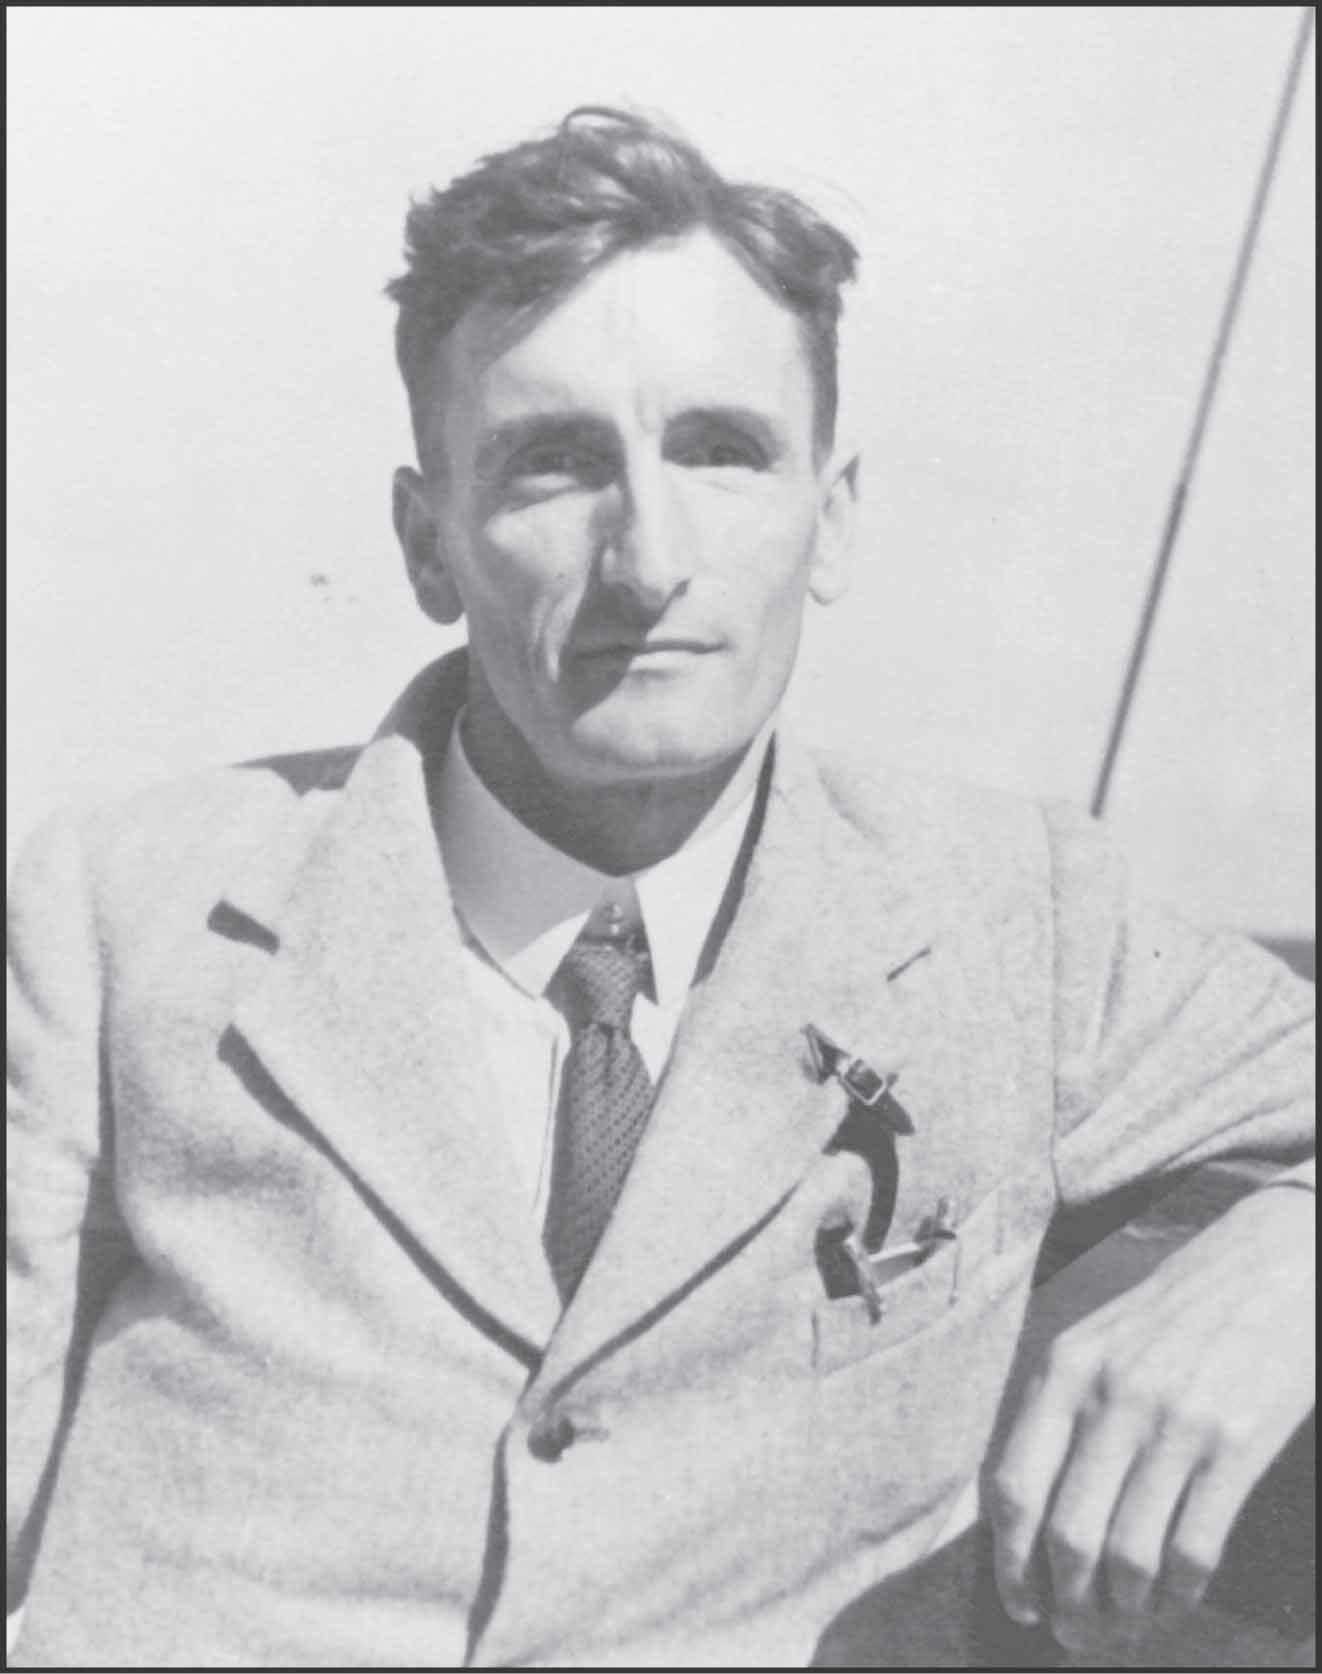
"Guy Callendar publishes the first direct observational evidence of global warming. He collects temperature measurements from 147 locations around the world and estimates that the global average temperature of the continents warmed by about 0.3 K [or °C] between 1880 and 1935. He also provides evidence that atmospheric carbon dioxide levels have increased, and that this increase explains about half of the observed warming."
Ed Hawkins, expert researcher in climate variability and change.
1940s to 1950s
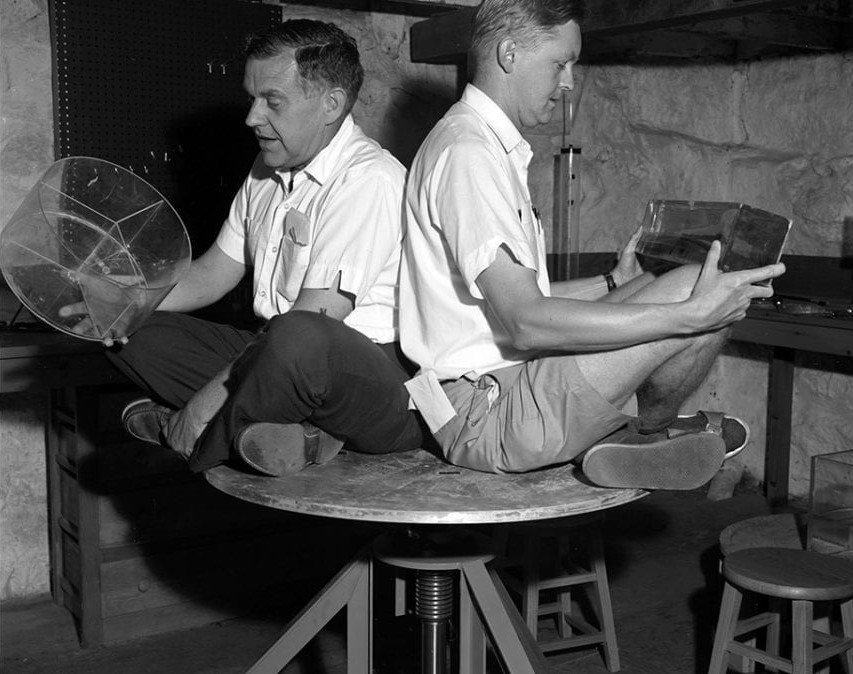
"American oceanographer Henry Stommel first described the general circulation of the oceans (called thermohaline circulation) caused by the differences in seawater temperature and salinity. Thermohaline circulation is a vast loop crossing all the oceans with deep currents and surface currents, of which the Gulf Stream is an example."
Anny Cazenave, expert researcher in space geodesy applied to the study of the planet (shape and gravity of the Earth, spatial hydrology and oceanography, sea level and climate).
1942
"Carl-Gustav Rossby and his work on “Rossby waves”, a major step in the analysis and understanding of oceanic and atmospheric dynamics."
Gilles Reverdin, oceanographer.
1945 - 1950
"A major step forward was the development of computers and the construction of numerical models of fluid flows governed by the (non-linear) Navier-Stokes equations, models applicable in particular to the Earth's atmosphere. This allowed the simulation of atmospheric circulation on a regional and then global scale over time intervals of a few days. This work took place mainly in England (where the weather is a favorite topic of conversation) and in the USA. The use of numerical models has remained an essential component of the study of natural phenomena to this day."
Pierre Morel, atmospheric science physicist.
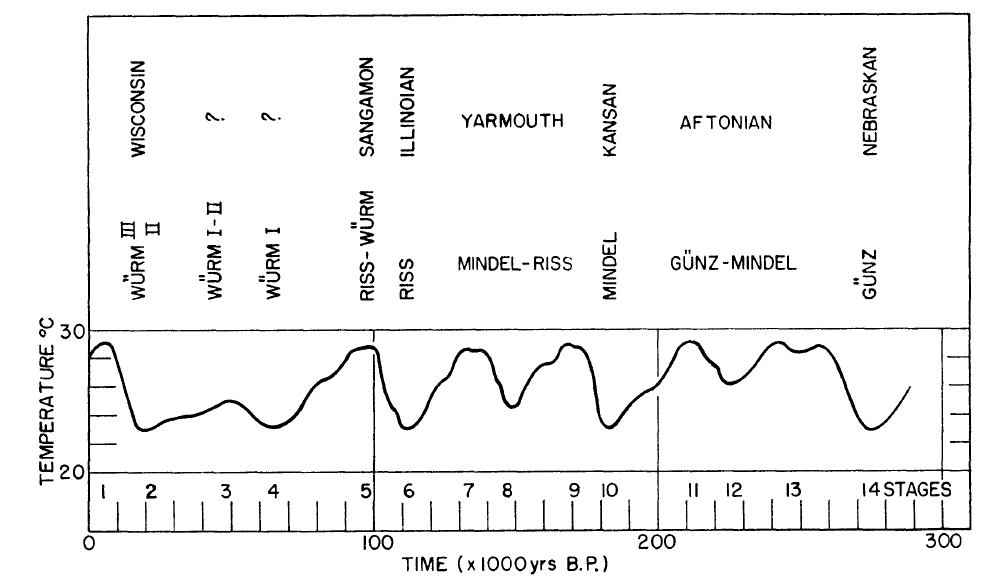
1955
"Cesare Emiliani uses carbonate isotopes (¹⁸O) from the calcareous shells of foraminifera to trace more than 15 glaciation cycles in marine cores, and makes the connection with astronomical theory."
Jean-Robert Petit, glaciologist.
1957
"Launch of the first artificial Earth satellite."
Anny Cazenave, expert researcher in space geodesy applied to the study of the planet (shape and gravity of the Earth, spatial hydrology and oceanography, sea level and climate).
1958
"Birth of the statistical theory of extreme values, with R. Fisher, L. Tipett, and E. Gumbel.
This theory describes the large variations of random variables, just as the Gaussian theory describes the mean. Gumbel was the first to use it to address hydrological issues. This theory is now part of the culture of the ESTIMR team [within the Climate and Environmental Sciences Laboratory]. I discovered this theory in 1988, when I was in my second year at the Ponts et Chaussées School, during a course on statistics of extremes."
Pascal Yiou, researcher in statistical climatology.
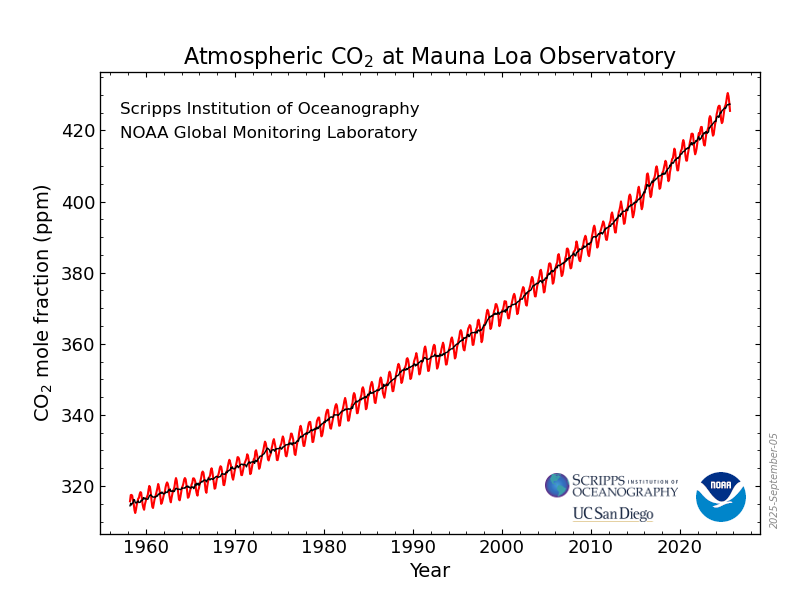
"First [reliable] measurements of atmospheric CO2."
Frédéric Parrenin, researcher expert in ice core dating.
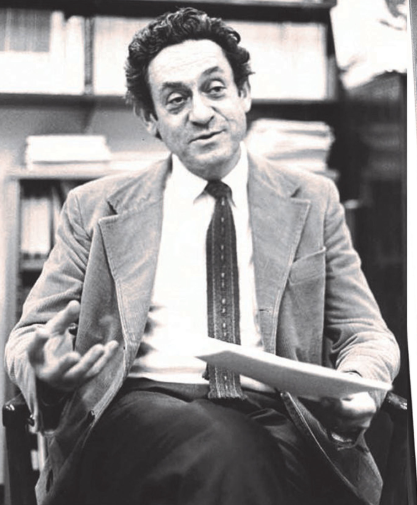
1963
"Edward Lorenz's paper describes chaos in a deterministic system. This opens the door to a whole body of work on nonlinear systems, predictability, and the description of variability.
I discovered this article in 1987, when I was at the end of my first year at the Ponts et Chaussées School, in a course on differential equations and the qualitative analysis of dynamic systems. My 'project' was to program the resolution of the Lorenz model equations and to visualize the sensitivity to initial conditions. It was a revelation. More than 30 years later, I still work with this model, for examples defining probabilities in deterministic systems."
Pascal Yiou, researcher in statistical climatology.
1964
"Willi Dansgaard publishes the use of water isotopes as a temperature tracer."
Anaïs Orsi, paleoclimatologist, specializing in the studying ice cores.
1967
"Manabe and Wetherald make a first estimate of a response to a doubling of CO2 taking into account the water vapor feedback, which shows the importance."
Jean-Louis Dufresne, climate physics researcher.
"Parameterization and evaluation of water vapor feedback in response to global warming in a simplified climate model (without cloud feedback)."
Hervé Douville, researcher in modeling and analysis of climate change and its consequences on the water cycle.
1968
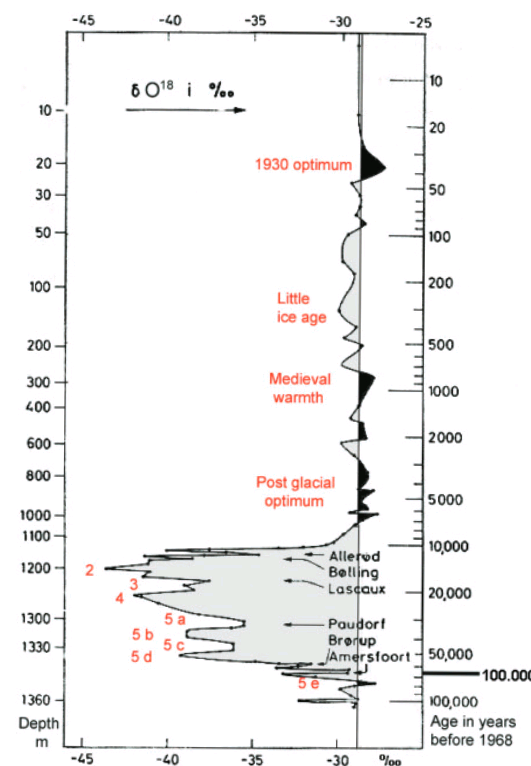
"Dansgaard et al. publish the 18O composition of the Camp Century ice core (80,000 years old) and link it to European cold events."
Jean-Robert Petit, glaciologist.
1969
"A meeting at NASA (Williamston, USA) with American and French scientists is held to establish a plan for studying the oceans from space. Space altimetry is discussed for the first time."
Anny Cazenave, expert researcher in space geodesy applied to the study of the planet.
1976
"Hays, Imbrie, and Shackleton published a study of a dated marine core (Indian Ocean) and the carbonate isotopes identified as an indicator of ice volume. The authors believed they validated Milanković's theory."
Jean-Robert Petit, glaciologist.
1979
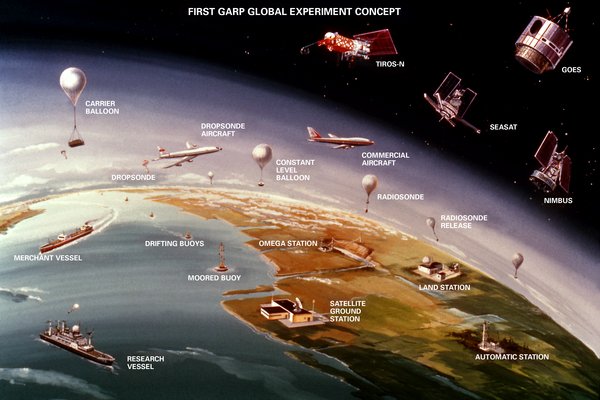
"The first global experiment of the Global Atmospheric Research Programme (GARP) and the beginning of the systematic use of in situ and satellite data to monitor the evolution of the atmosphere and the ocean globally."
Gilles Reverdin, oceanographer.
"An important step was the development, mainly in the USA, Russia and then France, of means of rapid collection (in a few hours) of meteorological observations across the planet.
The development of artificial satellites equipped with instruments has made it possible to remotely measure certain atmospheric parameters, including ground and atmospheric temperatures, cloud cover, and, in some cases, wind speeds. This work was coordinated globally by a committee bringing together university researchers and operational meteorological services within the framework of GARP – of which I was a member as the French representative."
Pierre Morel, atmospheric science physicist.
"The Charney report announces the global warming and proposes an estimate of the sensitivity of the climate (between 1.5 °C and 4.5 °C for a doubling of the atmospheric CO2 content once equilibrium is reached)."
Jean Jouzel, researcher in the field of climate change (vice-chair of IPCC Group I from 2002 to 2015).
"The Charney Report, the first synthesis on the estimation of global warming and climate sensitivity."
Jean-Louis Dufresne, climate physics researcher, studying climate change, feedbacks and energy exchanges by radiation.
1980
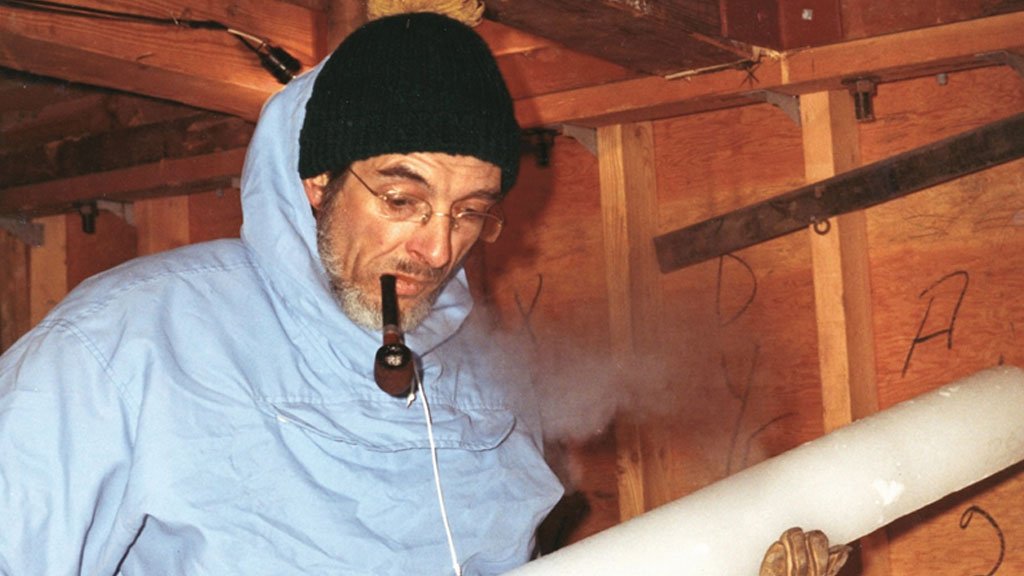
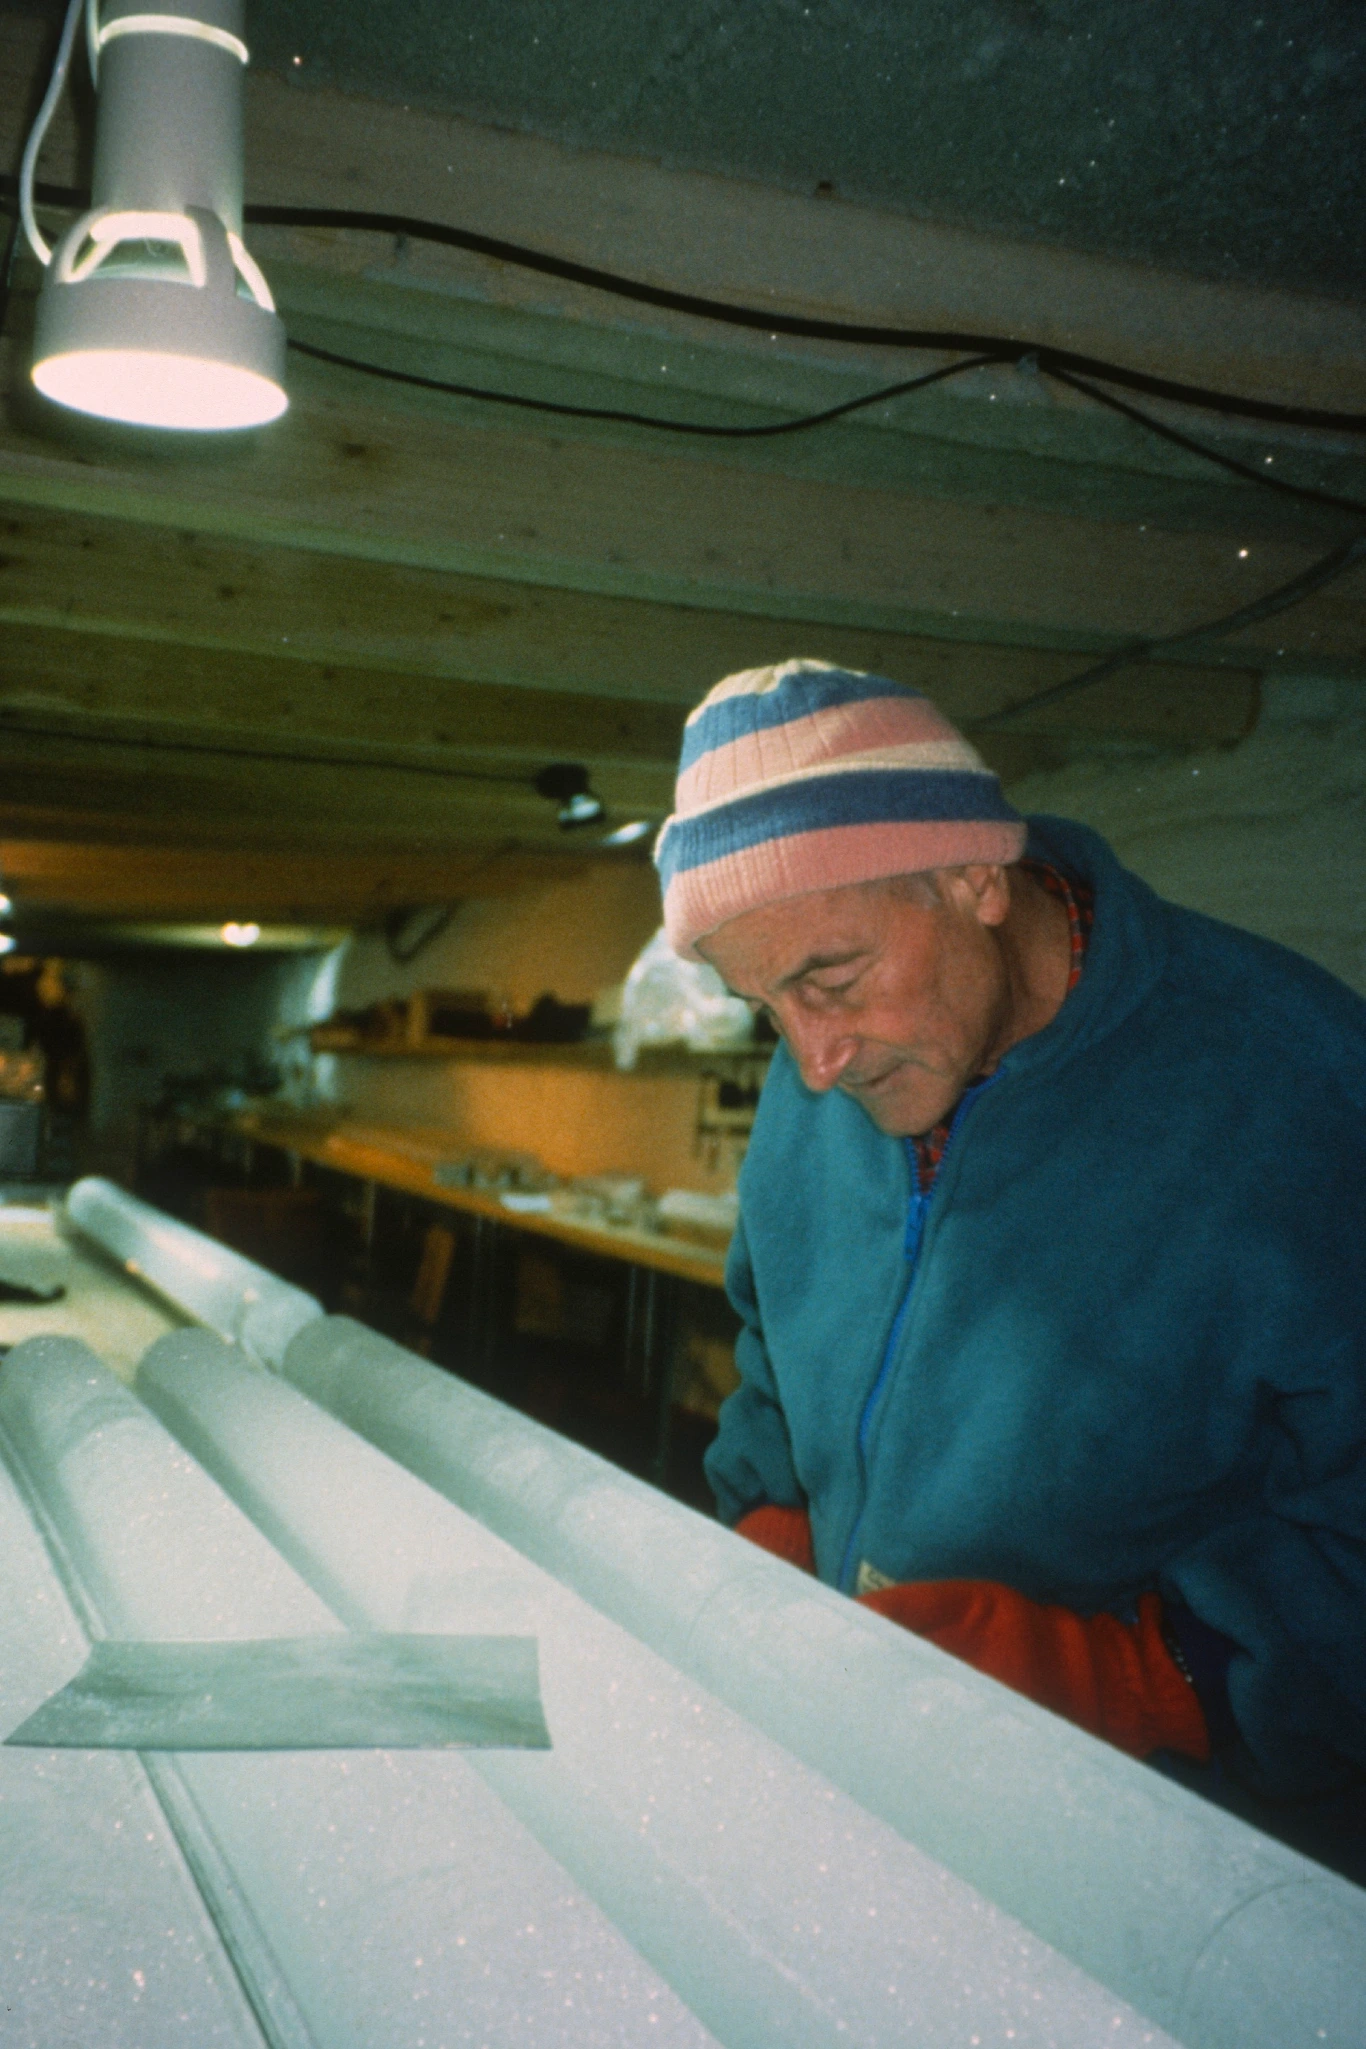
"Delmas, Ascencio, and Legrand developed a reliable technique for measuring CO2 in ice bubbles. They observed that there was less CO2 20,000 years ago, during the ice age."
Jean-Robert Petit, glaciologist.
1982
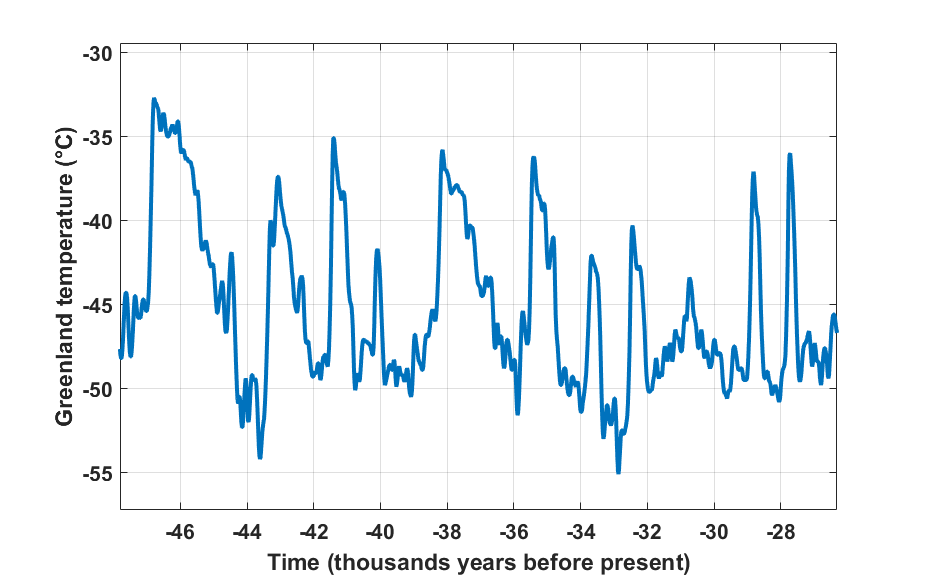
Data source: Kindler et al. (2014). Visualization: © Même Terre.
"Discovery in Greenland of rapid warming events known as 'Dansgaard–Oeschger', based on water isotopes measured in the Camp Century and Dye 3 ice cores."
Xavier Faïn, paleoclimatologist working on the reconstruction of past changes in atmospheric composition from ice cores, in order to better characterize natural climate variability or its more recent changes under anthropogenic pressures.
1984
"First comprehensive analysis of climate system feedbacks, by J. Hansen et al."
Jean-Louis Dufresne, climate physics researcher.
Visualization: © Même Terre.
"Mark Meier shows that mountain glaciers, even though they occupy a small area on Earth, are melting so quickly that they contribute to a third of sea level rise."
Étienne Berthier, glaciologist. Using images from Earth observation satellites, Étienne Berthier studies the evolution of mountain glaciers in order to better understand their responses to climate change and their contribution to rising sea levels.
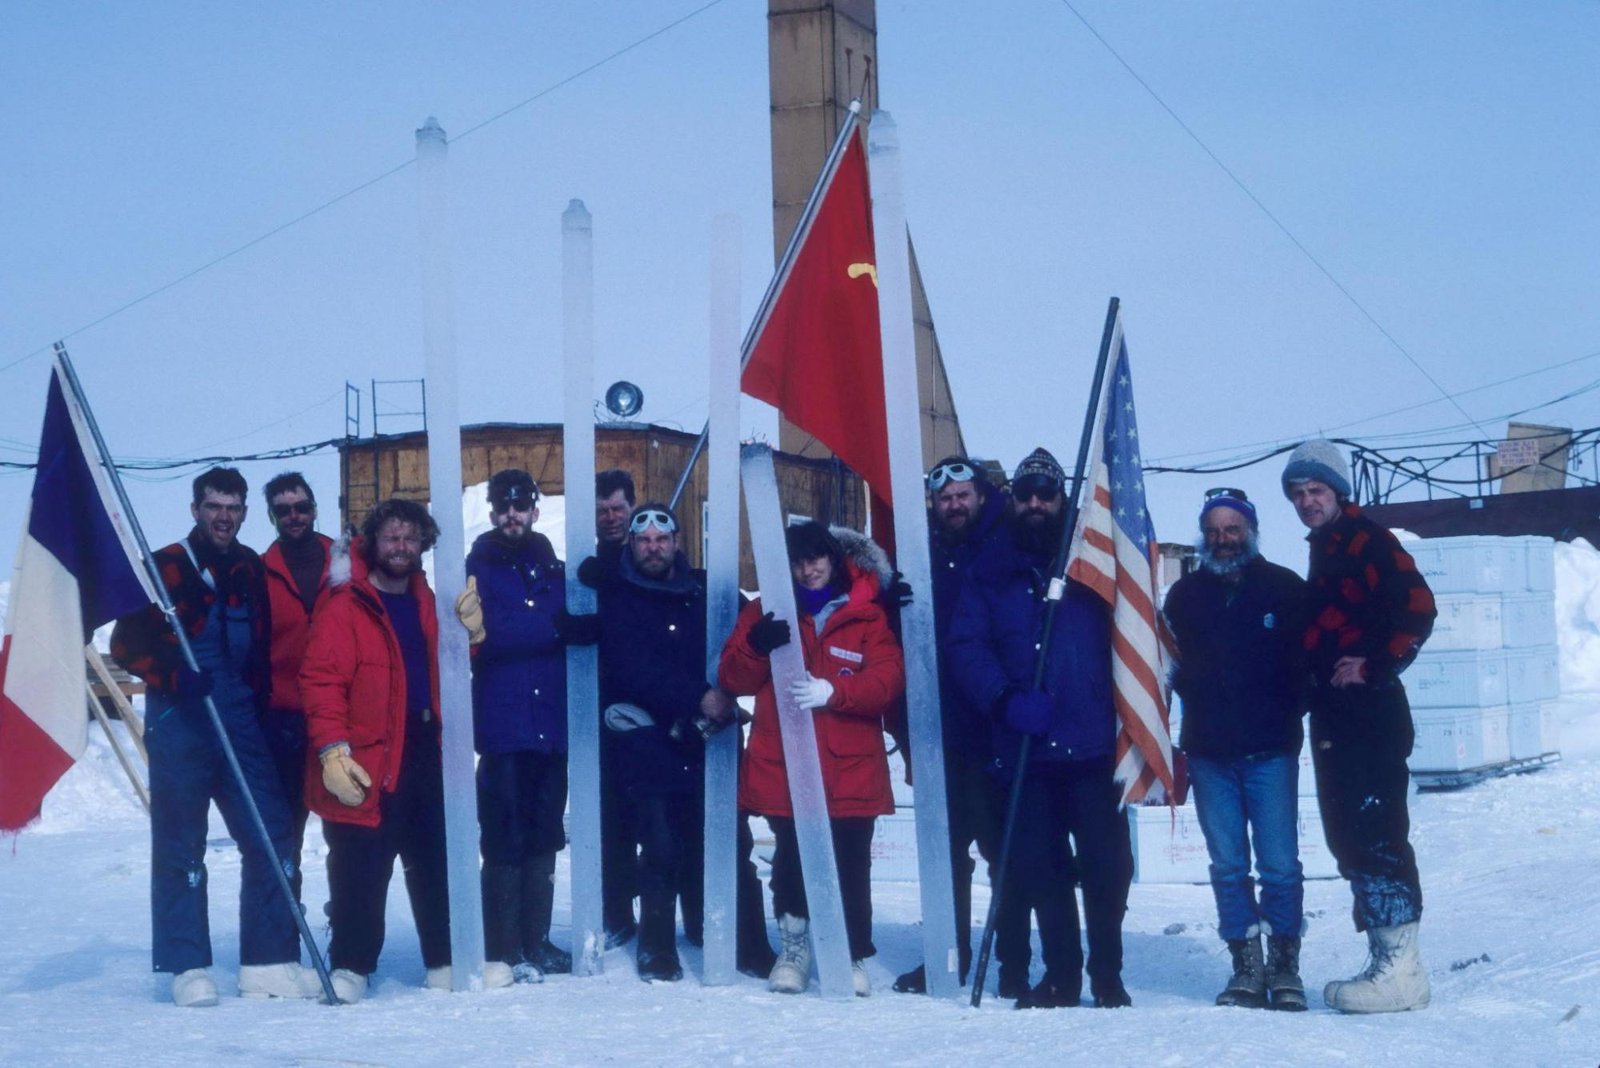
1987
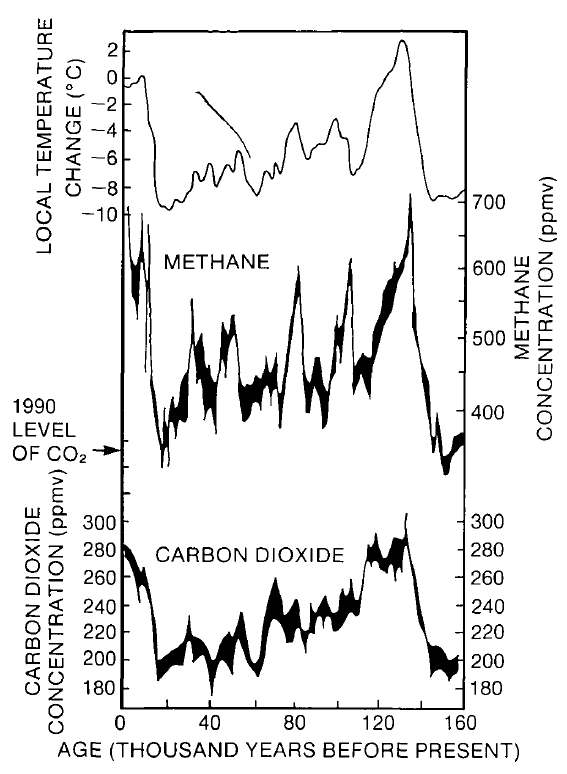
"Publication of the 160,000-year-old Vostok ice core analysis record. Three articles in Nature: temperature, CO2, and a correlation study between the two."
Jean-Robert Petit, glaciologist.
Frédéric Parrenin, researcher expert in ice core dating.
"These major results have since been clarified, and in 1990 constitute the second figure of the first IPCC assessment report."
Xavier Faïn, paleoclimatologist.
1988
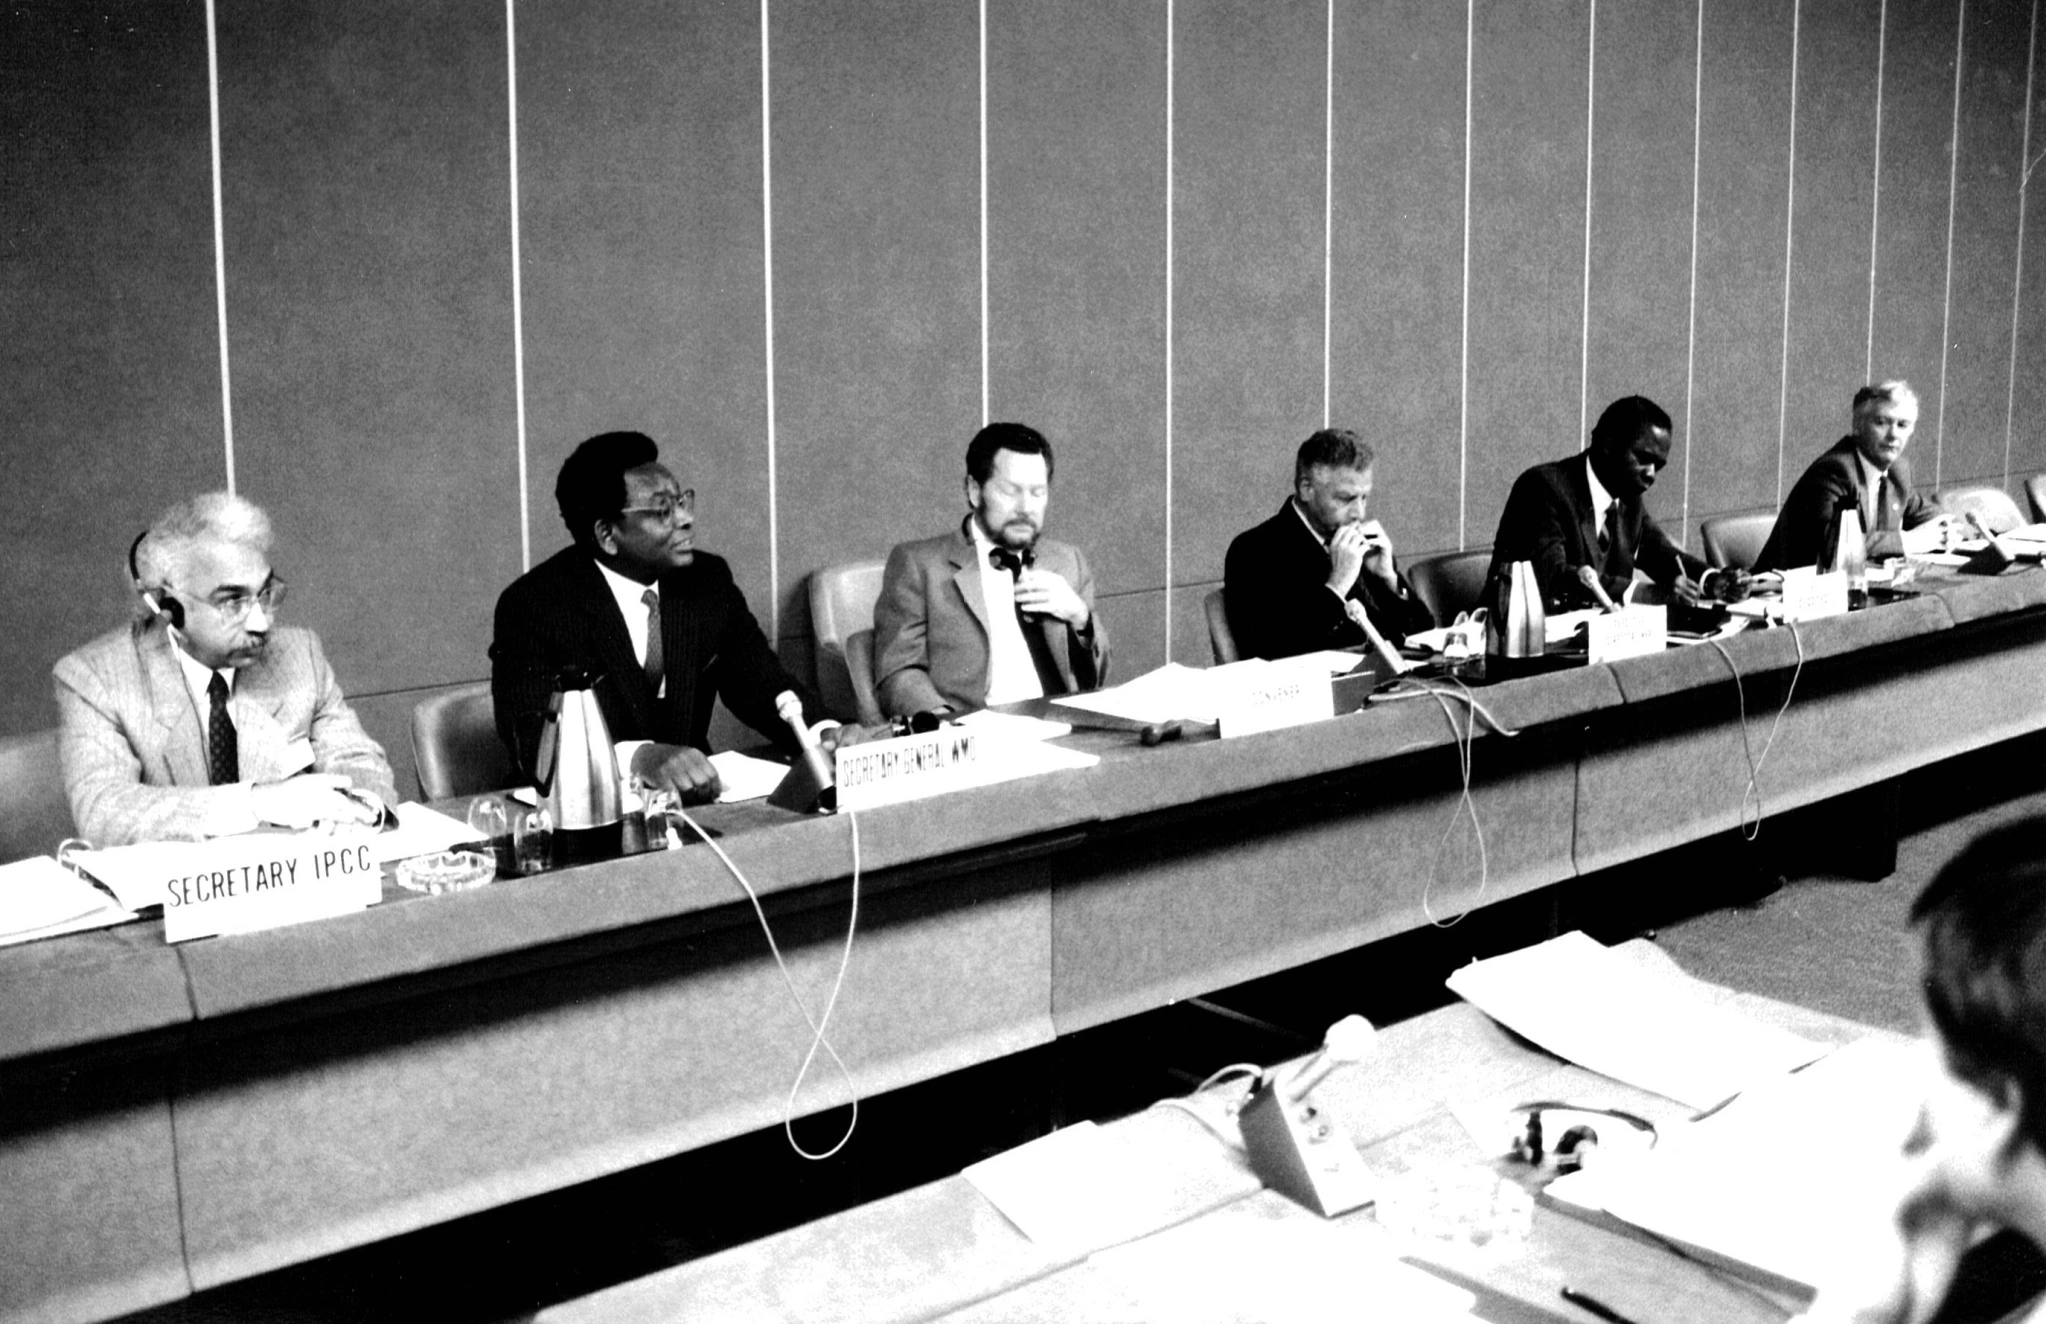
"Creation of the Intergovernmental Panel on Climate Change (IPCC)."
Frédéric Parrenin, researcher expert in ice core dating.
1989
"Creation of the Program for Climate Diagnosis and Intercomparison at the Lawrence Livermore National Laboratory (LLNL, USA). Its official goal is to improve understanding of differences between climate models. The first major project of this program, the Atmospheric Model Intercomparison Project (AMIP), began a year later. This gave climate modelers, for the first time, access to an institutional structure to compare and evaluate the performance of atmospheric general circulation models under similar conditions. By 1995, 31 modeling groups had participated in the project, representing almost the entire atmospheric modeling community."
Ludovic Touzé-Peiffer, researcher in convection modeling and the history of climate science.
1990
"Scientific article by Lorius, Jouzel, Raynaud, Le Treut, and Hansen, comparing the sensitivity of the climate to variations in CO2 and methane reported by the Vostok ice core and by the first general circulation models. Greenhouse gases are thought to contribute 50% of the temperature change between glacial and interglacial periods."
Jean-Robert Petit, glaciologist.
"First comparison of feedbacks between different climate models and highlighting of the dominant role of clouds in the uncertainty of climate sensitivity by Robert Cess et al."
Jean-Louis Dufresne, climate physics researcher.
"Increasingly complex numerical models are used almost universally to address all questions concerning the evolution of natural phenomena without leaving one's office, including the 'prediction' of future climatic and ecological changes. At the scientific level, these efforts are coordinated by a World Climate Research Program (WCRP) focused on physical aspects, while an informal 'coalition' of researchers encourages the study of chemical and biological processes within the framework of the IGBP (International Geosphere-Biosphere Program). Unfortunately, this work is not yet supported by an adequate basis of field observations of the very complex processes that affect the global environment. I myself was 'director' of the WCRP program at the World Meteorological Organization for its first twelve years."
Pierre Morel, atmospheric science physicist.
1991
"First quantitative estimate of radiative forcing due to aerosol-radiation interactions."
Olivier Boucher, climatologist.
1992
"Launch of the Franco-American altimetric satellite Topex/Poseidon dedicated to the ocean studies, in particular marine currents."
Anny Cazenave, expert researcher in space geodesy applied to the study of the planet.
1993
Data source: Kindler et al. (2014). Visualization: © Même Terre.
"Ice cores from Greenland demonstrate the existence of abrupt climate changes (over years or decades), with dozens of events documented during the last ice age."
Jeremy Shakun, paleoclimatologist.
1994
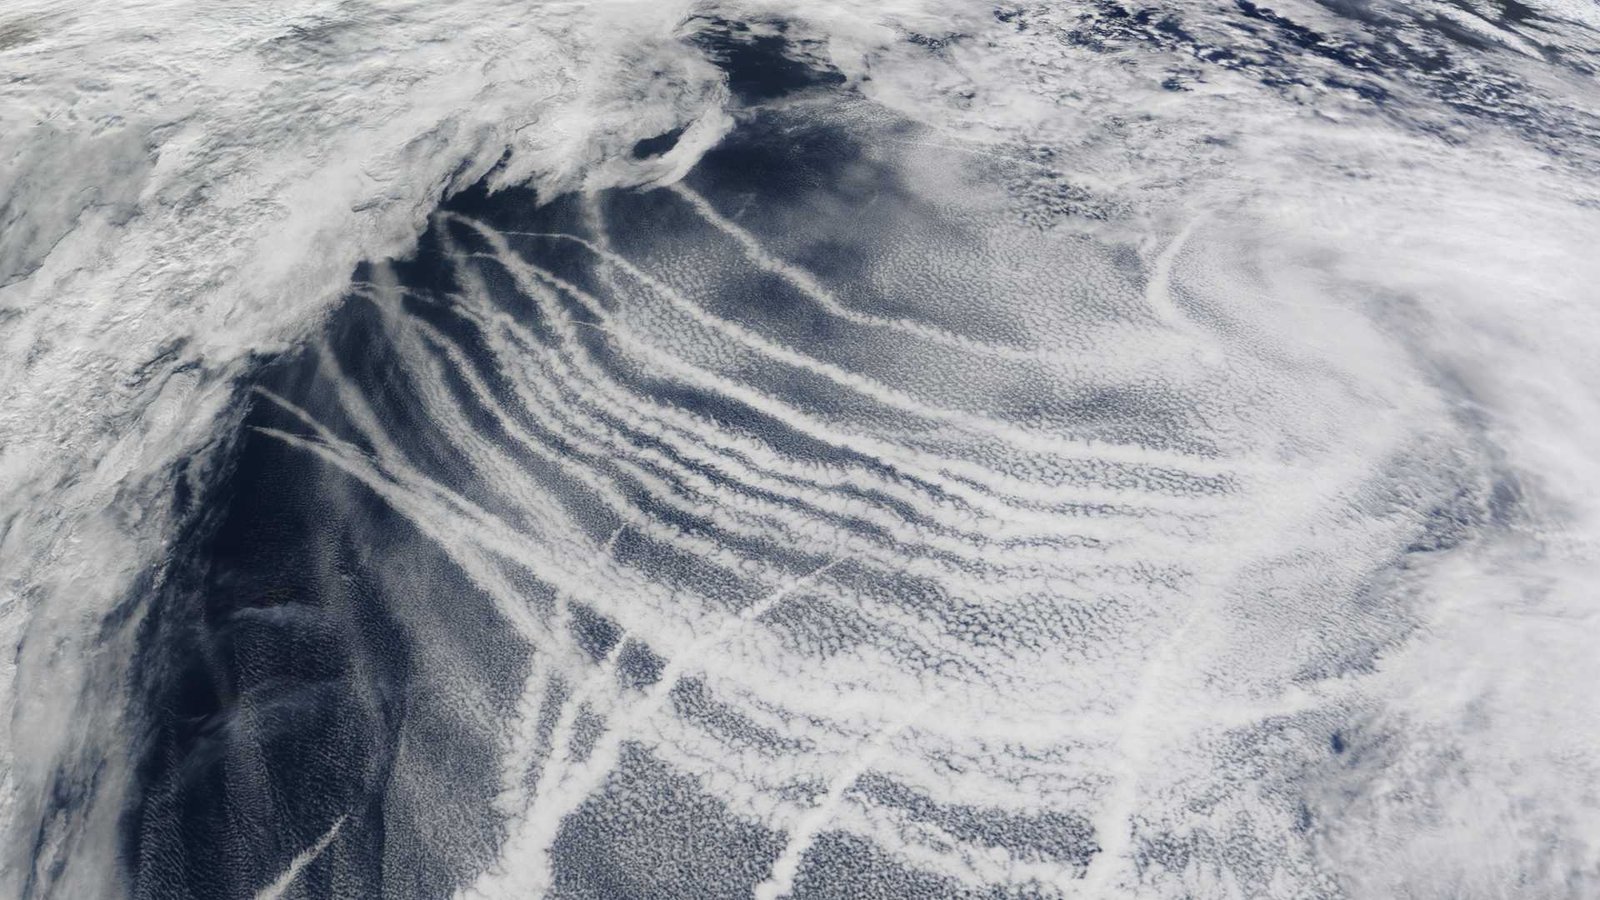
"First quantitative estimate of radiative forcing due to aerosol-cloud interactions."
Olivier Boucher, climatologist.
1996
"Following the success of AMIP, it was decided to organize a similar project around coupled general circulation models (GCMs), i.e., a coupling of atmospheric and oceanic models. This was the beginning of CMIP1, the first phase of the Coupled Model Intercomparison Project, with the objective of measuring and understanding the ability of coupled GCMs to simulate the current climate."
Ludovic Touzé-Peiffer, researcher in convection modeling and the history of climate science.
1997
"Launch of CMIP2, the second phase of the Coupled Model Intercomparison Project, which compared climate change simulated by coupled models and caused by a 1% annual increase in atmospheric CO2. This second phase was a major opportunity to make statements about anthropogenic climate change more robust. CMIP1 and CMIP2 played a significant role in the IPCC Third Assessment Report."
Ludovic Touzé-Peiffer, researcher in convection modeling and the history of climate science.
1999
"Scientific article in Nature 'Climate and atmospheric history of the past 420,000 years from the Vostok ice core, Antarctica'."
Jean-Robert Petit, glaciologist.
"J.R. Petit's article in Nature shows a strong correlation between CO2 concentration and Antarctic temperature during glacial cycles."
Anaïs Orsi, paleoclimatologist, specializing in the studying ice cores.
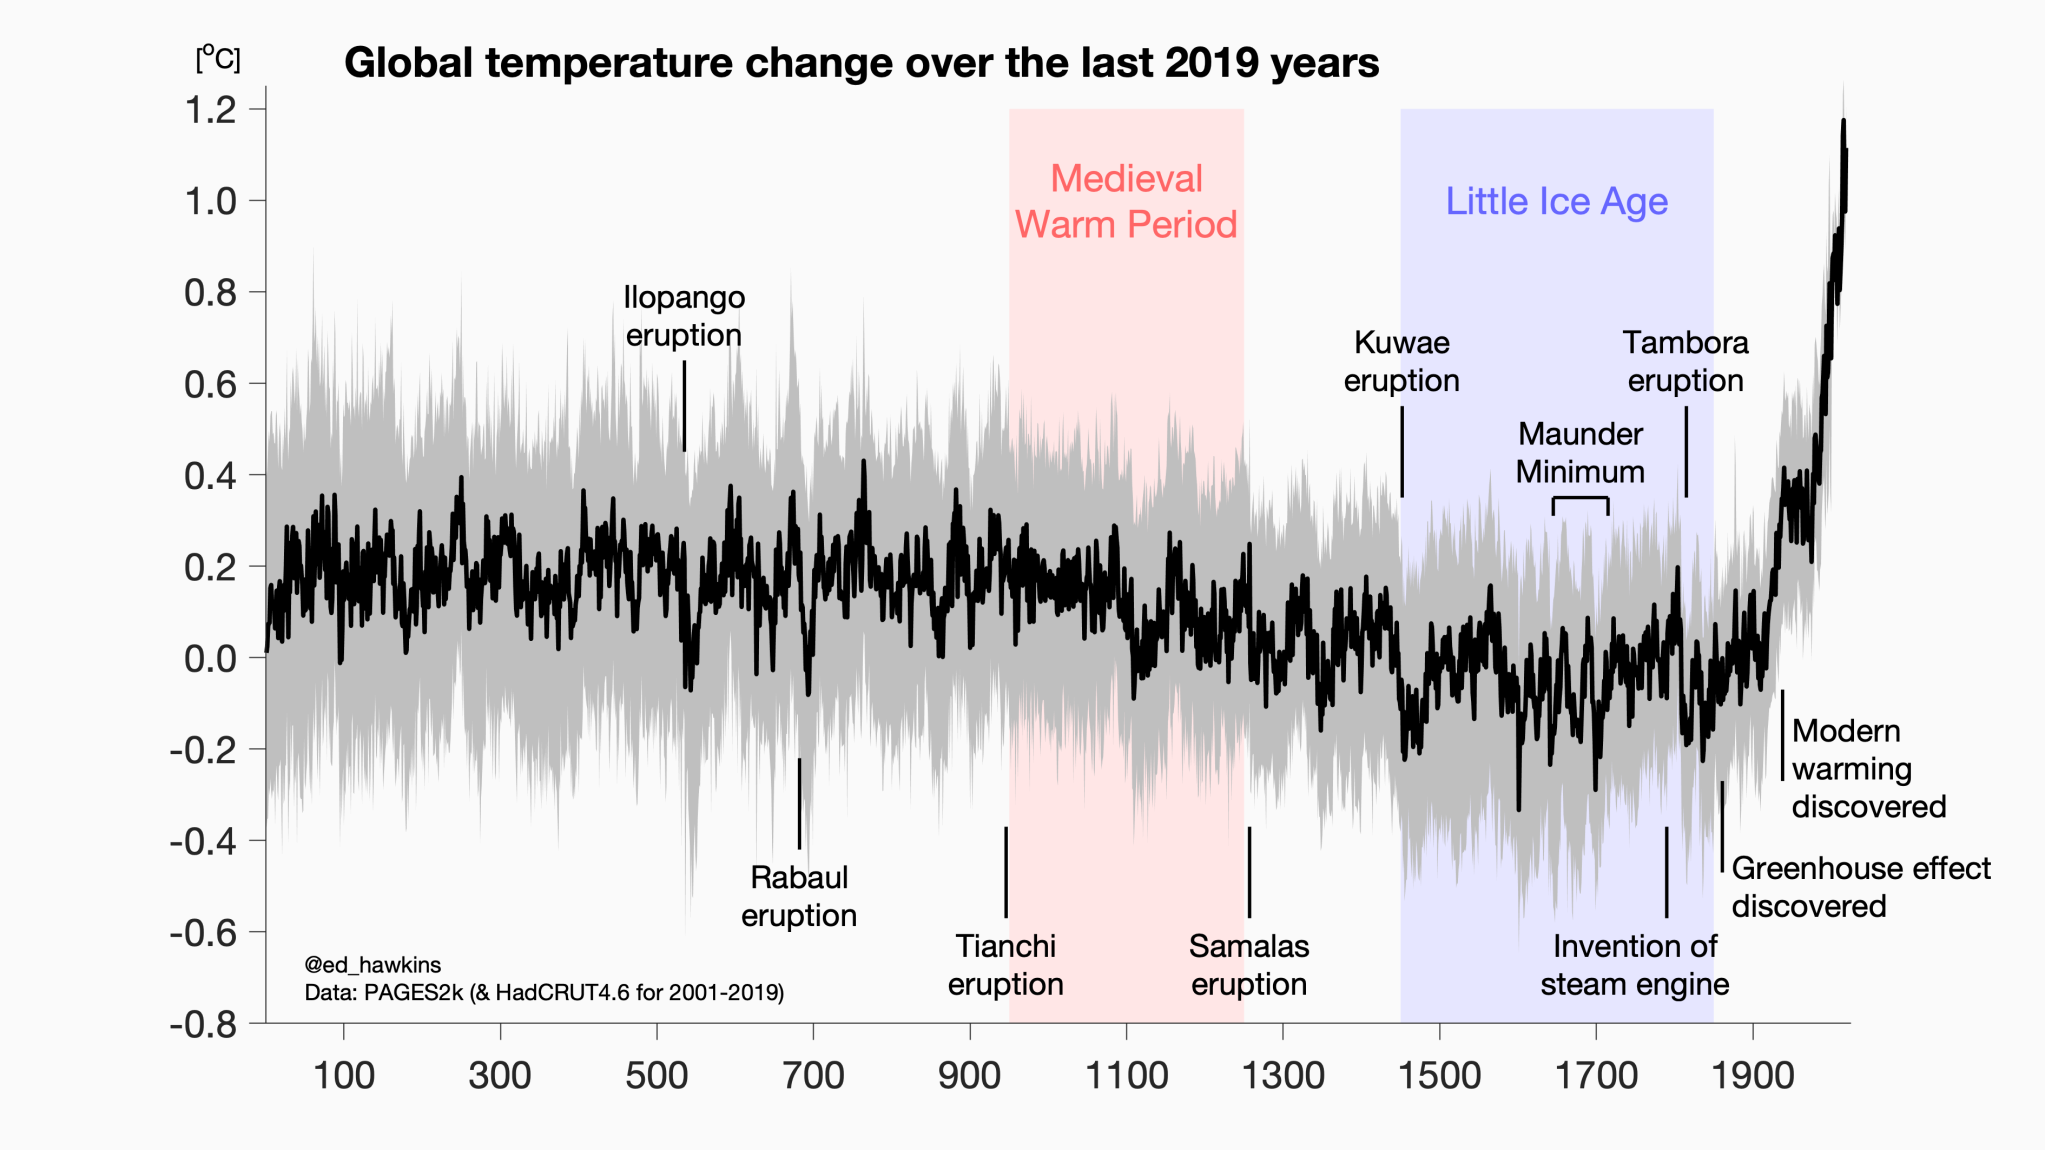
"A reconstruction of global temperatures from several indicators suggests that recent warming is unprecedented in the last millennium."
Jeremy Shakun, paleoclimatologist.
2003
"The Larsen B ice shelf is disintegrating: we have learned that ice sheets can melt very quickly. Since this event, ice flow models have been completely rewritten."
Anaïs Orsi, paleoclimatologist, specializing in the studying ice cores.
2004
"The announcement of the OCO (Orbiting Carbon Observatory) mission in 2004 by Crisp et al. definitively marked the field of greenhouse gas spectroscopy. It was subsequently followed by many others: GOSAT, OCO-2, TANSAT, MicroCarb, MERLIN, etc.
This is the first mission dedicated to mapping greenhouse gas sinks and sources. In particular, it has been mentioned that to achieve this goal, an accuracy better than a few per thousand is required for the mole fraction [i.e. the concentration] integrated over the entire atmospheric column of CO2 determined from the spectra measured by the satellite. This requires an accuracy never before achieved for the spectroscopic parameters of carbon dioxide and more generally of greenhouse gases. To meet this need, major efforts have since been made by the international community in molecular spectroscopy and optical measurement. Several high-resolution, high-sensitivity experimental techniques have been developed and used to precisely measure the spectral response of greenhouse gases in the laboratory […]. Several fine effects, previously neglected, are taken into account in the modeling of spectral signatures […]. Advanced analysis techniques are also being developed. In total, hundreds of studies have been carried out since then and others continue to be carried out to precisely characterize the spectral signatures of greenhouse gases."
Ha Tran, researcher with expertise in molecular spectroscopy of greenhouse gases, spectral modeling, and radiative transfer.
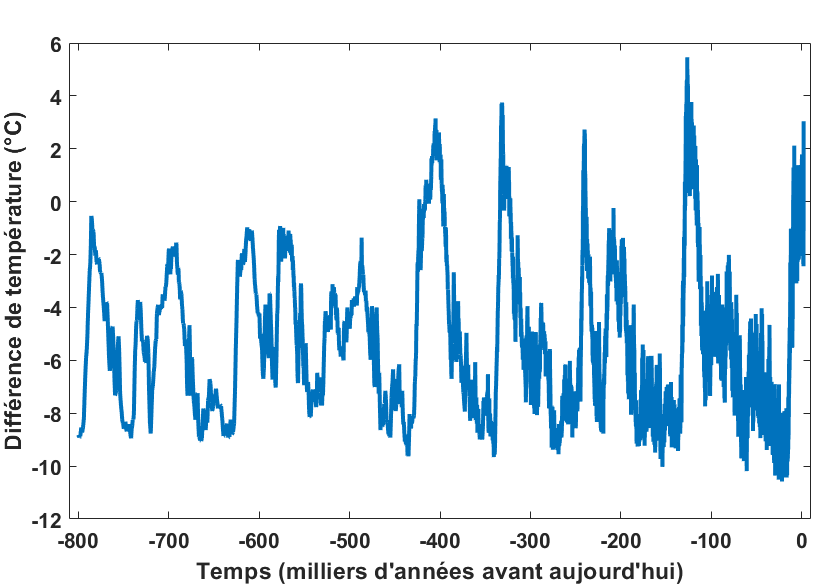
Data source: Jouzel et al. (2007). Visualization: © Même Terre.
"Ice core from EPICA Dome C: 800,000 years of temperature."
Jean-Robert Petit, glaciologist.
Xavier Faïn, paleoclimatologist.
2005
"Complete coverage of the ocean domain by Argo automatic floats which routinely measure the temperature and salinity of the first 2000 meters of the ocean."
Anny Cazenave, expert researcher in space geodesy applied to the study of the planet.
2007
"Nassim Taleb's book 'Black Swan' is about the description and dynamics of improbable but possible events. This book also reflects on our scientific practices, which seek causes where there may not be any."
"I discovered this book and the work of Taleb and others (like Didier Sornette, with whom I worked when I was at UCLA), in 2013. I was interested in the description of extreme events and their predictability. This book introduced me to a lot of things about 'unprecedented' events. Now, we see more and more scientific projects talking about 'black swans'."
Pascal Yiou, researcher in statistical climatology.
2008
The seasonal cycle is more pronounced in the Northern Hemisphere, which includes most of the land mass: photosynthesis causes the absorption of CO2 during the spring and summer. Carbon is then released by fallen leaves during the fall and winter. The figure on the right shows the evolution of CO2 concentrations over time in terms of the global average.
"Ice core from EPICA Dome C: 800,000 years of CO2 (Lüthi et al., 2008)."
Jean-Robert Petit, glaciologist.
2014
"Ben Marzeion and colleagues show that mountain glacier mass loss since 1850 (the end of the Little Ice Age) is largely explained by natural climate variability. However, 70% of glacial loss between 1991 and 2010 is attributed to anthropogenic forcing."
Étienne Berthier, glaciologist.
2021
"The ocean is routinely monitored from space by numerous onboard sensors. These measure currents, sea surface temperature and salinity, chlorophyll concentration in phytoplankton, surface wind and waves, and sea level rise related to global warming."
Anny Cazenave, expert researcher in space geodesy applied to the study of the planet.