Maps of annual average temperature in France (1940 to 2025)
In the plot, the annual average temperature is shown in term of anomalies. The anomaly here is computed as the temperature difference between the annual average temperature of each year and the average temperautre during 1940 and 1969. The anomaly is used to demonstrate the temperautre trend compared to an average condition.
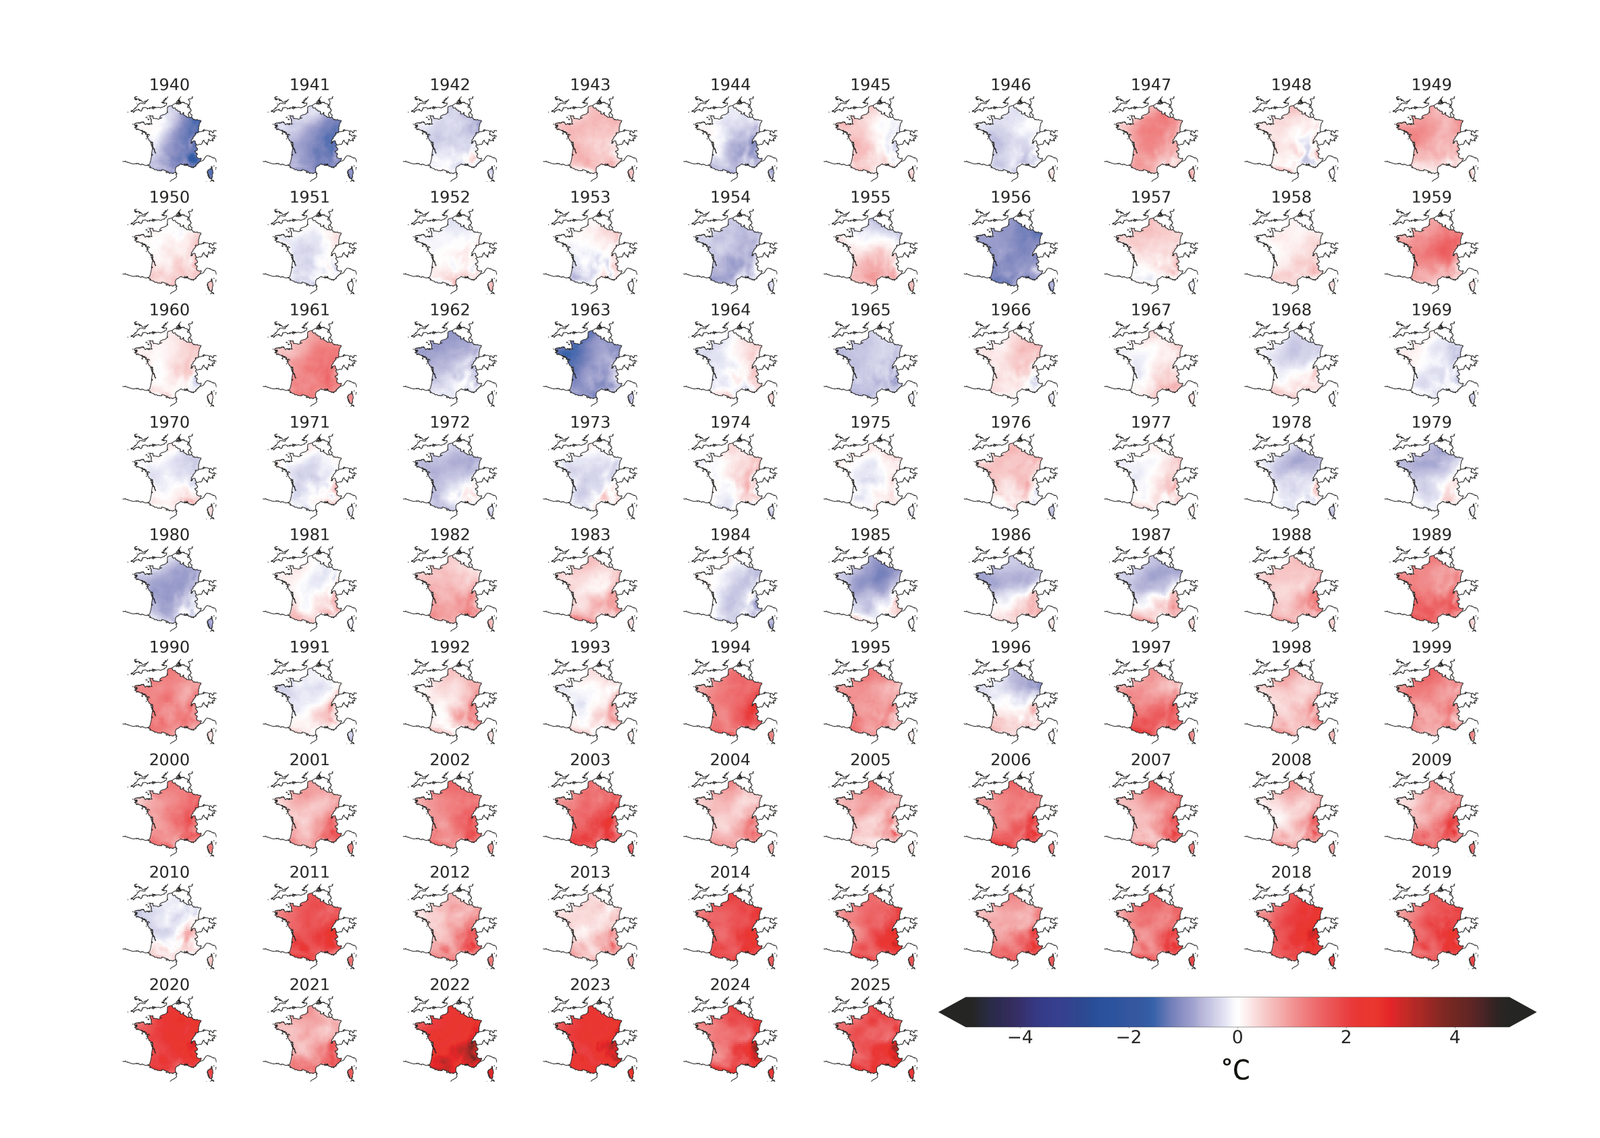
Data source: ERA5, 2026. Visualization: © Même Terre.